19.01.2026
Quality for distance learning
Lecturer Dashboard Introduced
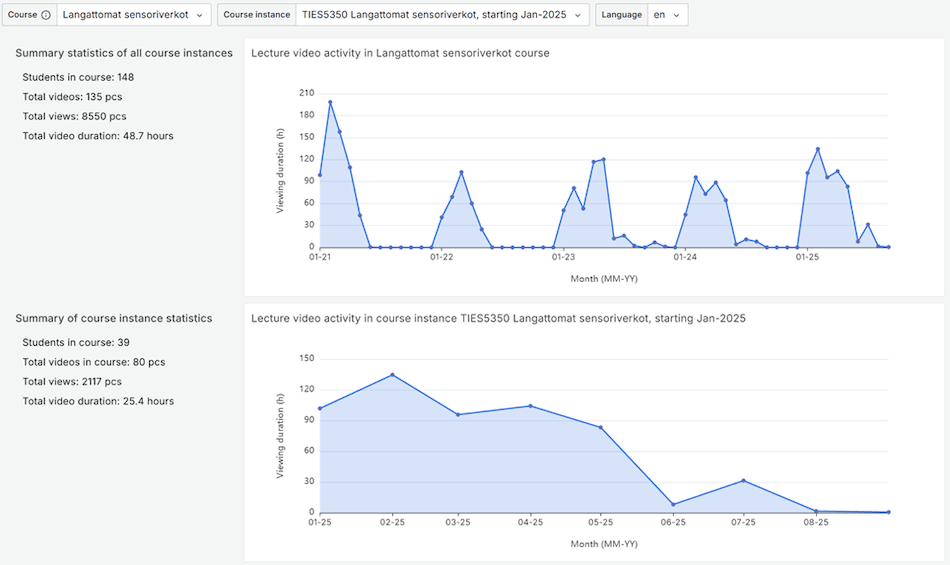
As part of the Laatua etäopetukseen project, visual dashboard views based on learning analytics data are being developed for those responsible for teaching, with the aim of improving teaching quality. The teaching staff view includes charts showing the usage rates of lecture videos. Each lecturer will only be able to see data related to their own course.
The view was presented to the teaching staff of the Information Technology unit. Next, lecturers will be interviewed based on the view, and it will be refined according to their feedback. Integration of the views into the CiNetCampus environment has been initiated.
News related cases
Utilization of data accumulated through virtual learningExtra information
Sanna Laine, project researcherTuomo Härmänmaa, project manager